The Ultimate Guide to Making a Georgia College Football Playoff Prediction That Actually Wins
Georgia’s path in the 12-team College Football Playoff comes down to efficient football and smart timing. I’ll use my AI-driven models—built on EPA, success rate, and schedule leverage—to map their seed range, bye odds, and host chances. We’ll translate numbers into clear checkpoints, factoring health, QB play, and SEC title leverage.
The most critical thing to understand here is that SEC title leverage matters more than pretty much anything else. If you win the league, you are basically chasing a top four seed and that coveted bye week. Even a one loss Georgia team with a strong strength of schedule and multiple ranked wins still holds very real equity for a bye, so panic is usually unnecessary after a single setback. You have to track the right stats each week because the scoreboard lies sometimes. I focus heavily on early down success, EPA per play, pressure rate, explosive plays, special teams EPA, and a quick check on turnover luck. It is also super helpful to compare closing lines versus your own numbers to see if the market is respecting Georgia or not.
When you look at what drives the floor of this team, it is honestly the health and the trenches. Quarterback play, the offensive coordinator's rhythm, offensive line protection, and defensive line havoc, plus the depth at receiver and corner, shape consistency way more than raw yardage does. Seeding swings massively on a few pivot games. If they win the swing spots, finish drives in the red zone, and avoid penalties, their host odds and bye odds move fast with even small performance changes. Our team uses ATSwins.ai , which is an AI powered sports prediction platform offering data driven picks, player props, betting splits, and profit tracking across NFL, NBA, MLB, NHL and NCAA, to turn these reads into actionable bets. Free and paid plans give bettors insights and simple how tos, so decisions get smarter, not noisier.
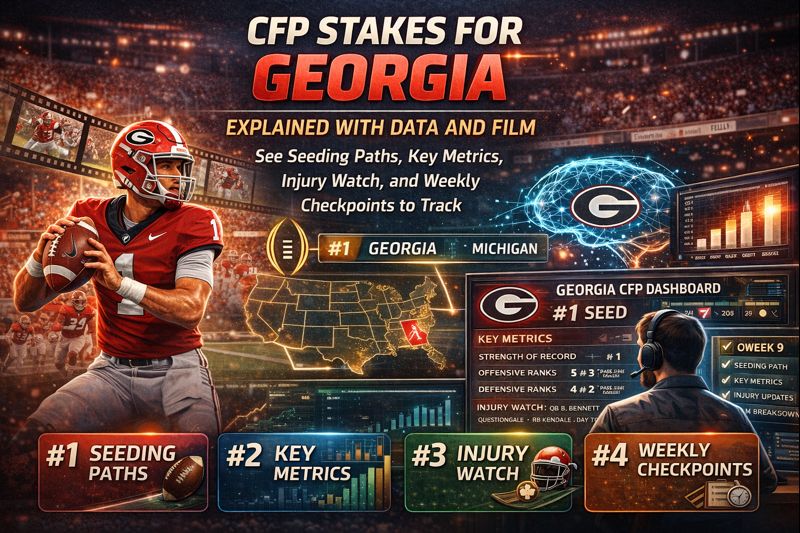
CFP stakes for Georgia
The 12-team format at a glance
The 2024 College Football Playoff structure matters to Georgia because it changes both the margin for error and the value of each data point the committee reviews. You have twelve teams qualifying, which is a huge shift from the old days. The top four conference champions earn first round byes and go straight to the quarterfinals. That is the golden ticket right there. Then you have seeds five through eight hosting first round games on campus against seeds nine through twelve. The first round winners advance to quarterfinal bowls, and the semis are also bowls, followed by the title game.
What this really means for Georgia is pretty straightforward but super important. Winning the SEC almost certainly locks a top four seed and the bye. A one loss Georgia with no SEC title can still be safely in the field, likely between seeds five and eight if the résumé is strong. The difference between seed four and seed five is massive because you are talking about a bye versus a home campus game. The gap between seed five and nine is also huge because hosting is way better than traveling. There is no cap on the number of teams from one conference if they meet the criteria. At large slots are selected on strength of schedule, ranked wins, head to head results, and overall team evaluation using film and data.
What the committee actually rewards?
Per the CFP selection protocol and historical habits, there are repeat priorities that you see pop up every single year. Conference championships, head to head results, and common opponents are primary tiebreakers. Strength of schedule is a must, meaning who you played and where you played them actually counts for a lot. They look closely at wins against ranked teams, and specifically as ranked at selection time, not just when they were played. Competitiveness without running up the score is a goal, and margin matters insofar as it reflects control and quality. Unavailable players due to injuries or suspensions are considered, especially if those players are expected to return. Since we do not have a prior search summary for this season's landscape here, we will lean on current season metrics, committee precedent, and the official language above to frame Georgia’s path.
Why seeding is volatile?
Seeding is volatile for a few key reasons. Georgia’s schedule strength can change weekly as opponents move up and down in the polls. The ranked win count shifts as teams enter and exit the rankings, which can be frustrating to track but is reality. A close loss or tight win might shift model based metrics like SP+, FPI, and EPA by several places, nudging the Dawgs across a seed line. SEC title game outcomes and other conference title upsets swing multiple bids at once. Volatility is highest in the last three weeks, when conference standings, injuries, and weather compress scoring environments and shrink predictive edges.
How ATSwins encodes these rules into projections?
ATSwins.ai models playoff odds through a blend of rating systems and market data. We look at power ratings derived from drive and play by play efficiency like EPA and success rate, adjusted for opponent and pace. We run schedule simulations with dynamic strength of schedule updates where ranked win probabilities are baked into each remaining game. We also consider committee behavior priors such as the fact that conference titles matter, strength of schedule and ranked wins are weighted, and late injuries shift power ratings in real time. Market movement and closing line information feed into win probability baselines week to week. The upshot is that for Georgia, our odds hinge on their offensive ceiling versus elite defenses, trench dominance sustaining on the road, and the SEC title swing.
Roster health and form
Quarterback play and OC tendencies
Quarterback play is the single largest lever in our model. We grade Georgia’s QB on accuracy over expectation on early downs, pressure to sack rate, and explosive pass rate alongside red zone decision making. You have to ask if he is getting rid of the ball or taking drive killing sacks. Then you have to look at the offensive coordinator's tendencies. We look at early down pass rate versus expectation to see if there is a tendency to throw into favorable boxes. We also track play action and RPO usage on standard downs and fourth down aggressiveness because these hidden points change win equity.
To track this yourself, you should chart early down calls and success rate after each game. Note the QB scramble success and designed runs because Georgia often weaponizes QB mobility on critical third and short situations. A practical step after each game is to log early down pass rate, EPA per dropback, and QB time to throw. A rise in early down pass rate alongside stable success is a bullish signal for playoff seeding.
Offensive and defensive lines
When we talk about the trenches, the offensive line metrics to watch are pressure rate allowed on true pass sets, stuff rate allowed in short yardage like third or fourth and short, and penalties that stall drives. On the defensive line, we look at havoc rate which combines tackles for loss, batted balls, and pressure. We also check the run stop rate against power concepts and pass rush win rate versus top offensive line units. We weigh trench composite grades heavily because they travel well. In road games and neutral sites, Georgia’s two deep at OL and DL often swing win probability more than skill positions do.
Explosive rate and finishing drives
Explosive rate is crucial. On offense, this is the percent of plays gaining fifteen plus yards. On defense, it is the percent of plays allowed at fifteen plus yards. Finishing drives is another massive metric. This measures points per trip inside the forty for the offense and points allowed per trip inside the forty for the defense. Championship contenders sit in the top ten nationally in at least two of the four categories. Georgia’s typical title contender profile features elite finishing defense and above average explosives on offense.
WR, RB, and CB availability
For wide receivers, track snap counts for the top three receivers because continuity matters more than raw yardage. If a WR1 is out, watch yards per route run for the secondary receivers to see if they can separate on third and medium against man coverage. For running backs, the room health impacts pass protection more than raw rushing yards. Note pass protection reps and missed blitz pickups week to week. For cornerbacks, the availability of the second corner or slot corner changes coverage shells and pressures. Without corner depth, Georgia’s pressure package becomes less aggressive, and that drops defensive havoc. For real status updates and participation reports, open the weekly notes and pressers on the official team site. Skim the injury mentions and look for position group rotations in snap charts.
Returning production vs. in‑season development
Returning production sets the preseason baseline, but in season development determines the ceiling. You want to watch for freshmen and sophomore reps increasing in the front seven. You also want to see offensive line combinations settling by Week six to eight. Wide receiver chemistry with the QB in scramble drills and choice routes is also vital. Better late season youth development correlates with conference title performances and committee confidence if there is a single late loss.
How to use practice notes and quotes?
Postgame quotes can be telling. If the OC is talking about execution or identity, pay attention because execution issues tend to correct faster. Defensive assistants discussing communication errors are not red flags if they shrink week to week. With practice notes, limited or non contact players early in the week that upgrade by Thursday often play on a pitch count. Beat writers hinting at package specific roles signal tailored game plans for ranked opponents.
Efficiency profile and schedule leverage
Benchmarking Georgia with SP+ and FPI
We blend multiple rating systems to anchor projections. SP+ is a tempo and opponent adjusted measure of efficiency, explosiveness, and finishing drives. FPI is an opponent adjusted power rating that projects point spreads and win probabilities. The ATSwins composite merges SP+, FPI, closed market numbers, and our drive based EPA model. Definitions we rely on include EPA per play, which is the value added relative to down, distance, and field position. Success rate is the percent of plays that increase expected points. Havoc rate involves the defense generating TFLs, PDs, and turnovers. Finishing drives measures scoring efficiency once a team crosses the opponent’s forty. Small changes in SP+ and FPI after ranked wins or close calls often signal more to the committee than raw margin. Improving success rate on early downs without more explosives is still good as it stabilizes variance and travel performance.
The metrics Georgia must own
On offense, Georgia needs a top ten EPA per dropback and a fiftieth percentile or better explosive run rate, even if the passing game is the hammer. They also need a low sack rate despite a decent average depth of target. On defense, they need to be top ten in finishing drives allowed and top twenty in havoc rate. They must limit explosives allowed, especially against top twenty five offenses. Add special teams to the mix by looking for hidden yards on punts and kickoff return defense, as well as field goal reliability from forty to forty nine yards in neutral sites.
The pivotal swing games and why
Map Georgia’s swing games into three buckets. Rank A includes the SEC title game and top fifteen road or neutral opponents. Rank B includes home tests against top thirty power ratings. Rank C involves trap spots between ranked opponents or after a road win. Why it matters is simple. A Rank A win pushes bye odds up sharply. Sweeping Rank B games without style point obsession preserves health while boosting the résumé. Avoiding an upset in Rank C is just as important as beating a ranked foe because the committee punishes bad losses more than it rewards blowouts.
SEC title implications, clinch math
Win the SEC and you are a near lock for a top four seed and very likely a top three. One loss plus an SEC title means you are still a bye unless the field has multiple unbeaten champs. One loss without an SEC title means a high probability of seeds five through eight, especially with two ranked wins. Two losses with elite strength of schedule and multiple ranked wins means you are still live for seeds nine through twelve, especially if those losses are close and key players return. Clinch scenarios are simplified as follows. If Georgia wins out pre Atlanta and wins the SEC title game, the bye is clinched. If Georgia wins out pre Atlanta and loses narrowly in Atlanta to a top five foe, host odds remain strong if there are two ranked wins. If Georgia drops a late road game but wins Atlanta, bye odds rebound toward the top four.
Pathways and scenarios
Best‑case pathway
In the best case pathway, Georgia wins the SEC and secures a top two seed. If early down success rate is top ten through November, then Georgia’s offense is balanced enough to score on elite defenses. If the defensive finishing rate holds top five, then SEC title game win equity is north of fifty five percent. If Georgia logs two or more ranked wins before the SEC title game, then a top two seed is reachable with a win in Atlanta. What we’d expect to see is a QB completion rate above expectation on standard downs, a healthy WR1 with seventy percent plus snaps in November, and an OL penalty rate decreasing with short yardage conversion clearing seventy percent.
Resilient path
The resilient path involves one loss with elite strength of schedule and two ranked wins. If one loss is away or neutral and within one score, then the model discounts it modestly. If the SOS remains top ten by season’s end, then ranked win count becomes the tiebreaker. If Georgia arrives in Atlanta with a chance to avenge a loss, then a win restores bye probability. Key needs in this path include a healthy cornerback room to manage the SEC title opponent’s pass game, special teams avoiding negative EPA because missed FGs under fifty yards are costly with the committee, and the OC maintaining pass rate over expected in favorable boxes rather than turtling.
Risk path
The risk path involves an injury hit stretch and tiebreak chaos. If WR1 and CB2 miss time concurrently, then explosive differential tightens and potential upset risk rises in Rank B or C games. If Georgia splits late games and misses the SEC title, then the seed drops to seven through twelve depending on other champs and ranked wins. If turnover luck regresses sharply with negative fumble luck, then depend on early down efficiency to stabilize margins. What stabilizes this path is trench depth and lower penalty rates, continued top ten finishing defense, and a single ranked road win late to offset résumé softness.
Using strength of schedule tiers to estimate needed win equity
You can pull opponent tiers from public strength of schedule sites, then tag Georgia’s remaining opponents. Tier 1 are top ten SOS component opponents. Tier 2 are eleven to thirty. Tier 3 are thirty one to sixty. Tier 4 are sixty plus. Win equity targets for a bye are two and zero versus Tier 1 and 2 down the stretch plus an SEC title win, or three and one combined versus Tier 1 and 2 including Atlanta. For a host seed five through eight, you need at least two wins versus Tier 1 and 2 even without Atlanta, avoiding Tier 3 and 4 losses. For seeds nine through twelve, split Tier 1 and 2 and avoid two losses in the final month.
Scenario mapping
At ATSwins, we use an at a glance mapping for Georgia’s range, assuming an average SEC title opponent. If the record in the last four including the SEC title is four and zero with two to three ranked wins and at least two Tier 1 games, the likely seed band is one to three with very high bye odds. If the record is three and one with a loss in Atlanta, the seed band is four to six with moderate bye odds and high host odds. If the record is three and one with a loss pre Atlanta but a win in Atlanta, the seed band is two to four with high bye odds. If the record is two and two with no bad losses and two ranked wins, the seed band is six to nine with low bye odds and moderate host odds. If the record is two and two with a Tier 3 or 4 loss and only one to two ranked wins, the seed band is nine to twelve with very low bye odds and low host odds. Host odds reflect the chance of landing seeds five through eight specifically, where campus games are played.
Target performance thresholds
We do not treat these as hard rules, but hitting these levels makes the top four far more likely. For a bye, look for an offensive EPA per play rank in the top eight, defensive finishing drives rank in the top eight, explosive pass rate in the top twenty, explosives allowed in the top twenty, havoc rate in the top twenty, and penalty yards per game under forty five. For a host spot, the targets loosen slightly to top fifteen in EPA and finishing drives, top thirty in explosives and havoc, and penalty yards under fifty five. If Georgia sits near or above these lines by Thanksgiving, the model typically elevates their bye probability even before Atlanta.
What to monitor weekly?
A step‑by‑step ATSwins checklist
Use this quick weekly routine to keep Georgia’s playoff prediction live and current. First, update injuries and participation by opening the weekly notes at the official site. Log players returning from injury and note snap counts for key skill positions. Mark any new OL or DL rotations or pitch counts. Second, refresh efficiency deltas by recording EPA per play and success rate on offense and defense. Tag early down pass rate, pressure rate allowed, and defensive havoc rate. Track finishing drives on both sides of the ball. Third, adjust SOS and opponent tiers by pulling updated tiering with strength of schedule trackers. Reclassify upcoming games by tier and mark swing games. Fourth, validate film notes with splits. Pull tempo splits, third down distance, red zone attempts, and explosive play counts from standard stat sites. Check situational tendencies to see if Georgia’s explosives are coming on early downs or if they are third and long prayers. Fifth, compare market to model. Note the lookahead line and the closing line. If the market moves toward Georgia without a clear injury catalyst, model confidence is increasing. If the market moves hard against Georgia after an unpenalized game, recheck trench data. Sixth, re run seed odds and trigger scenarios. If Georgia clears a Tier 1 opponent by any margin and remains healthy, raise bye odds a notch. If Georgia has a scare against a Tier 3 or 4 foe, lower the ceiling slightly unless injuries explain it.
Key indicators with quick thresholds
Watch for injury report drift. It is positive if starters upgrade by Thursday and negative if limited tags persist into Friday walk through notes. For yards per play margin, plus one point five YPP against non cupcakes is elite. For early down success rate, fifty two percent plus on offense is strong, while keeping forty percent or lower allowed on defense is key. For pressure rate, under thirty percent on true pass sets for the offense is healthy. Over thirty five percent versus top forty offensive lines for the defense means the pass rush is playoff ready. For special teams EPA, any negative trend in kickoff coverage or forty to forty nine yard field goals is a warning sign. For turnover luck, if fumble luck is plus three or worse over a month, expect some regression and do not overreact to a single outlier game.
Using tempo and situational splits to confirm what you saw
Pace matters. If Georgia speeds up versus inferior opponents but slows down versus ranked defenses, that is controlled adaptability. For the red zone, track play action calls because success here is predictive of neutral site finishing efficiency. For third down, average to go distance matters more than conversion rate. If Georgia lives in third and short, their early down plan is working. Pull these weekly at standard stat sites and paste them into your tracking sheet.
A lightweight tracking template you can use
Set up columns in your spreadsheet for Week, Opponent Tier, Result, YPP Margin, Off SR, Def SR, EPA Off, and EPA Def. Also track EDPR, Pressure Allowed, Sack Rate, Explosive Pass Rate, Explosives Allowed, Finishing Drives Off and Def, ST EPA, Penalties, and Injuries. Include Market Open and Close, Model Spread, Delta, and Notes. Flag cells green if they are a top ten metric nationally, yellow if eleven to twenty five, and red if twenty six plus. When three or more red flags cluster on either offense or defense in a two week window, lower Georgia’s ceiling for one week until the next data point.
How ATSwins weights market movement and closing lines?
Closing line is the sharpest composite sentiment of power ratings and injuries. If Georgia consistently beats their closing expectation by more than three points net, the model upgrades them faster than raw score margins. Conversely, a win that misses expectation by more than three is a minor downgrade, more so if injury neutral. We also track opponent reaction. If Georgia beats a ranked team and the market upgrades that opponent the next week, it is a stronger résumé win.
Our current prediction range and why
We blend drive based efficiency, opponent tiers, and SEC title leverage. With no prior search summary, we are taking current season form and precedent to set a probabilistic band. The seed band most likely is two to six. The rationale is that Georgia’s typical efficiency footprint produces double digit win probability in most SEC games and keeps them favored or close to pick’em in Atlanta. The likelihood to earn a bye is approximately forty to sixty percent. Drivers up include a healthy WR1 and CB2, improving early down pass rate, and plus two or better ranked wins before Atlanta. Drivers down include CB depth issues, special teams EPA negative, and two or fewer Tier 1 or 2 wins. The probability to host a first round game is approximately seventy to eighty five percent if they miss the bye. Drivers up include avoiding bad losses, strong SOS, and a narrow SEC title loss to a top five opponent. Drivers down include a late injury run, a Tier 3 or 4 upset loss, and multiple other conference champions staying unbeaten. A reasonable seed tree for Georgia based on typical November performance patterns suggests winning out including SEC title gets a seed one to three. Winning out but losing a close SEC title gets a seed four to six. Dropping a late road game but winning the SEC title gets a seed two to four. Splitting the final two and missing the SEC title gets a seed seven to eleven depending on ranked win count and SOS.
How to translate this into bets and edges?
ATSwins is built to turn these football realities into betting edges. In futures markets, buy Georgia to Make the Playoff when their host seed probability plus bye path exceeds market price by ten percent or more. If the market overreacts to a close win versus a Tier 3 opponent, look to add in small increments before a Tier 1 matchup that can swing résumé. In game to game situations, track Georgia’s early down pass rate vs expectation. If the OC’s aggression goes up against man heavy defenses, overs on team totals may have value. Look at QB pressure to sack rate and opponent’s pass rush win rate. If mismatch favors Georgia, lay modest spreads earlier in the week. For props, check WR1 snap counts and air yards. If healthy and target share spikes, ladder yardage can be viable. RB pass pro usage hints at pass heavy scripts, so pivot from rushing yards to receptions when blitz heavy defenses are on deck.
Common pitfalls to avoid in playoff predictions
Avoid over valuing margin versus weak opponents because the committee and markets care more about control against ranked teams. Do not ignore injury context because a narrow win with three starting DBs out is not a negative. Do not chase narratives after one game, but rather stay anchored to efficiency and market closes. Do not forget that strength of schedule is dynamic. As opponents rise or fall, Georgia’s résumé shifts without them playing a snap.
The weekly “go/no‑go” signals for a bye push
The Go signals are when OL cohesion shows fewer penalties and better short yardage conversion, defensive explosives allowed trend down across two weeks, and WR1 and CB2 snap shares stabilize near pre injury levels. The No Go signals are when special teams EPA turns negative for two straight weeks, early down success rate dips below forty eight percent on offense in back to back games, and injuries stack in the DB room, forcing softer coverage shells.
What a realistic November looks like for a bye contender?
One ranked win late or a top fifteen road win is usually needed. You need a clean injury bill at QB, WR1, CB2, and OL cornerstone. You need an Atlanta performance that looks repeatable on film with a strong early down plan, few coverage busts, and no meltdown on special teams.
A short process you can repeat every Sunday night
Update injuries and snap counts for ten minutes. Pull EPA, success, finishing drives, and havoc for ten minutes. Re tier opponents and update SOS for five minutes. Compare ATSwins model spread vs lookahead line for five minutes. Note any mismatch flags for the next opponent for five minutes. In thirty five minutes you will be back to an accurate Georgia playoff probability and seed band that reflects what the committee values and what the market priced.
Why our confidence band isn’t tighter?
Committee human elements and late season chaos mean our bands intentionally leave room. Weather and neutral site variance dampen scoring, compressing spreads. Independent conference races can flood the field with strong champs, pressuring at large seeds. Injury returns in title week can change how a committee judges earlier results. Still, Georgia’s structural advantages like line play, defensive versatility, and typically efficient offense keep their floor high. That is why, unless multiple negative indicators cluster, our model’s base case keeps them between seeds two and six, with a fair shot at the bye if November health cooperates.
Conclusion
We wrapped the CFP outlook with what matters most: efficient play, schedule leverage, and health. Key takeaways are to track EPA and success rate, trenches and QB stability, and watch market versus model edges. The big idea is process over hype. For sharper calls, ATSwins brings AI powered data driven picks, player props, betting splits and profit tracking across NFL, NBA, MLB, NHL and NCAA. Free and paid plans deliver insights and guides so bettors make smarter, more informed decisions.
Frequently Asked Questions (FAQs)
What is a Georgia college football playoff prediction?
A Georgia college football playoff prediction is basically a forward looking call about Georgia’s odds to make, seed, and advance in the 12 team CFP. It is not just a guess; it blends committee criteria like wins, losses, strength of schedule, and ranked wins with hard performance data. In plain terms, it asks how strong Georgia is right now, how tough the path is, and what the SEC title picture means for their seed. The key drivers you should weigh include strength of schedule and ranked road wins, which are massive. You also have to look at efficiency stats like EPA per play and success rate because they tell the real story of how a team is playing down to down. Quarterback stability, injuries, and depth on both lines are also critical factors. You need to keep an eye on explosive plays for and against, finishing drives, and red zone TD rate. Turnover margin is another big one, specifically whether it is luck or pressure driven. Finally, SEC title leverage is huge because a conference crown boosts seed and bye odds significantly.
How do strength of schedule & ranked wins impact a Georgia college football playoff prediction?
They are essentially the backbone of the entire prediction. A Georgia college football playoff prediction leans heavily on who you beat, where you beat them, and when you beat them. A tough schedule plus multiple ranked wins signals staying power and raises Georgia’s ceiling for a top four seed. Remember that the top four conference champs get byes, so this is super important. Close losses to elite teams usually hurt less than soft wins against bad teams. In practice, beating ranked opponents, especially away from home, moves seed lines more than running up scores on weaker teams ever could. Late season ranked wins weigh a bit more because the résumé ages in November, and the committee wants to see who is good right now. A strong nonconference win can also be a resume anchor if SEC play gets messy later in the year.
What stats should I track weekly to update a Georgia college football playoff prediction?
You should keep it simple but sharp. Update your Georgia college football playoff prediction with a few sticky metrics that really matter. Early down success rate is huge because it sets the whole game script. EPA per play on offense and defense is the best measure of overall efficiency. You also want to track pressure rate and pass protection, specifically the sack to pressure ratio. Explosive play rate, meaning twenty plus yard gains allowed and created, is a great indicator of a team's ceiling. Finishing drives, which is points per trip inside the forty, tells you if they can actually score when it matters. Penalties and special teams swings are often overlooked but can decide close games. Finally, keep a close watch on injury reports, snap counts, and who is trending up. Do not overreact to one game, but rather look for three to four week trends and matchup driven changes.
Can ATSwins.ai improve my Georgia college football playoff prediction, and how does it work?
Yes, absolutely. ATSwins.ai is an AI powered sports prediction platform offering data driven picks, player props, betting splits, and profit tracking across NFL, NBA, MLB, NHL, and NCAA. Free and paid plans give bettors insights and guides to make smarter, more informed decisions. With Georgia, you can align your Georgia college football playoff prediction to live market signals and model outputs. How to use it fast is pretty simple. Compare your Georgia college football playoff prediction to ATS spreads and totals in the platform’s dashboards. Check betting splits to see when public versus sharp money diverges. Track profit and closing line value so you know if your read on Georgia is beating the market. Use player props movement as a hint on QB health and game plan shifts. It is a really powerful tool to explore more at ATSwins.ai.
When should I bet futures based on a Georgia college football playoff prediction?
You should time it around information, not vibes. For a Georgia college football playoff prediction, consider early summer for small nibbles before camp if you have a strong injury return and depth read. Then look at post September. After three or four games, efficiency stabilizes and you can size up because prices are still usually fair. Before SEC title week, you might want to hedge or press depending on the seed path and injuries. Avoid buying after a statement blowout when the market already moved because you are paying a premium. Add on dips, say a narrow loss with strong underlying metrics. Keep units steady and do not chase steam too late in the process.
Related Posts
AI For Sports Prediction - Bet Smarter and Win More
AI Football Betting Tools - How They Make Winning Easier
Bet Like a Pro in 2025 with Sports AI Prediction Tools
Sources
The Game Changer: How AI Is Transforming The World Of Sports Gambling
AI and the Bookie: How Artificial Intelligence is Helping Transform Sports Betting
How to Use AI for Sports Betting
Keywords:
MLB AI predictions atswins
ai mlb predictions atswins
NBA AI predictions atswins
basketball ai prediction atswins
NFL ai prediction atswins
ai betting analysis