Sports Betting Smarter: Turning Stats into Winning Edges
Smart handicapping blends film, numbers, and context, and that is exactly where I thrive. As a professional sports analyst building AI models, I focus on breaking complex edges into simple, repeatable steps. In this guide, we’ll take raw data and turn it into calibrated probabilities, translate lines into value, and explore practical workflows you can copy, test, and scale confidently. Think of it as combining stats, intuition, and workflow design into something that actually works.
Table Of Contents
- Stats-Driven Sports Betting That Actually Moves the Needle
- Data sources and key metrics
- Feature engineering and odds normalization
- Modeling and calibration
- Validation, backtesting, and risk
- Workflow, tools, and references
- Step-by-step: building an NBA sides model that translates to bets
- Templates and checklists
- Comparative model table
- Common mistakes and troubleshooting
- How ATSwins puts this to work for you
- Odds normalization playbook (quick math you can use)
- Practical EV thresholds by market conditions
- Building CLV awareness into your routine
- A simple walk-forward plan you can copy
- What to do when the model stalls
- Repeatable habits that pay off
- Ethics and transparency earn trust
- A quick prop modeling outline
- Helpful patterns for NCAA markets
- Putting it all together with ATSwins
- Conclusion
- Frequently Asked Questions (FAQs)
Key Takeaways
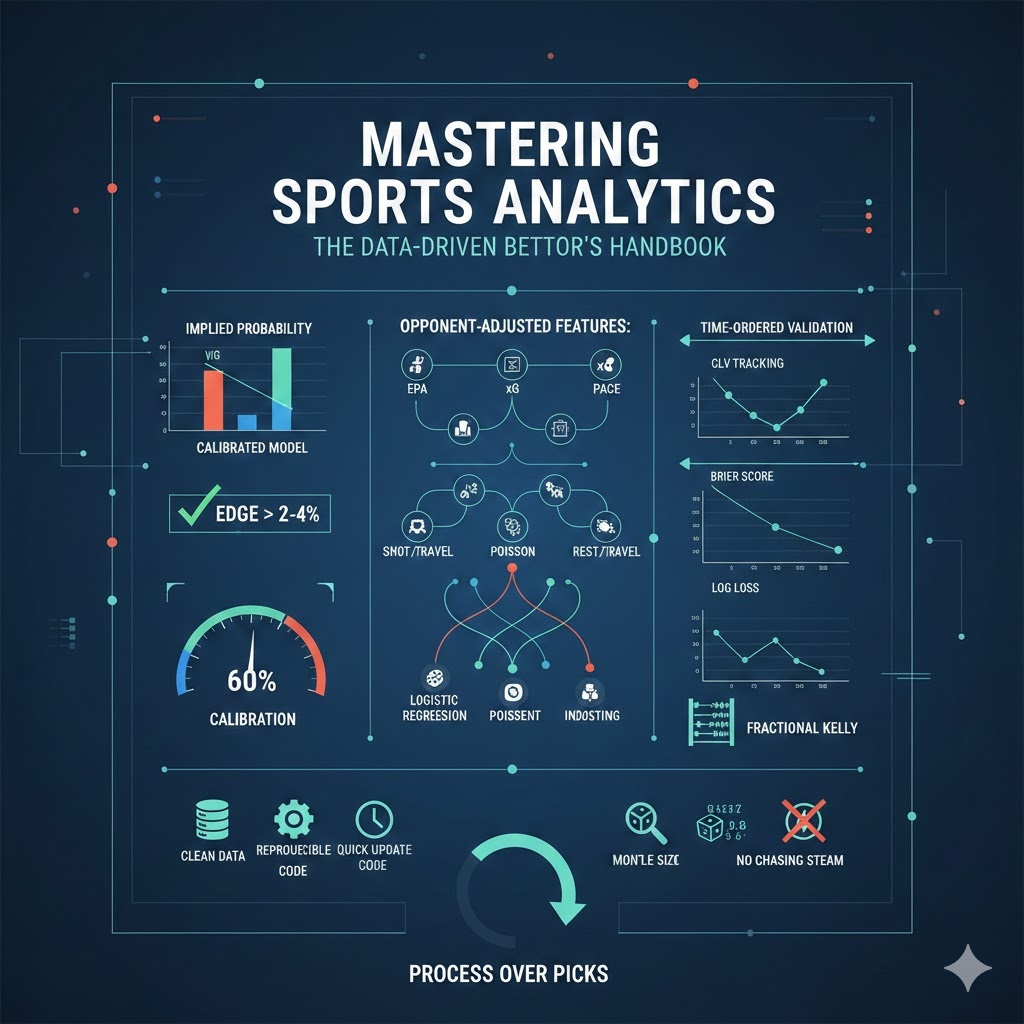
The first thing to remember is value. Always convert odds into implied probability, remove the vig, and compare it to your calibrated model. Only place a bet if your edge clears a threshold, typically around 2–4%. If it doesn’t, skip it. Build opponent-adjusted features that actually matter. Think EPA or xG, pace, shot quality, rest and travel, injuries, and use rolling windows. You can model with logistic regression, Poisson, or gradient boosting. Then calibrate so that a predicted 60% probability really means a 60% chance.
Evaluation is key. Time-ordered validation beats random splits, and metrics like Brier score and log loss tell you much more than hit rate ever could. Reliability plots, closing line value (CLV) tracking, ROI, and drawdowns are essential. Bet sizing should follow fractional Kelly, log everything, and learn fast. The workflow should hold up under stress: clean data, reproducible code, quick updates, Monte Carlo simulations for robustness, attention to sample size, and never chasing steam. Focus on the process over individual picks.
ATSwins puts this into practice by running this approach across sports like NFL, NBA, MLB, NHL, and NCAA. Its AI-powered platform provides data-driven picks, player props, betting splits, and profit tracking. Both free and paid plans are available to help bettors make smarter decisions with confidence.
Stats-Driven Sports Betting That Actually Moves the Needle
The foundation of solid sports betting is stats-driven analysis. You cannot make consistent predictions without clean, timely data. At ATSwins, we anchor our models on official league feeds first, then historical archives for cross-checking and consistency. Box score and play-by-play data are essential. Daily, we pull official feeds for games, teams, players, and event logs, structuring them into tables for easy analysis. We also store raw snapshots alongside processed features so you can audit changes over time.
Market data is equally critical. Opening, midpoint, and closing lines from regulated books provide context, while consensus averages and derivative markets like totals and props enrich the dataset. Capturing timestamps for each move allows us to link odds with team news. Creating features like time-to-close, last-hour volatility, and public vs. sharp splits gives insight into where markets might be mispriced. This helps measure CLV, which is often the ultimate test of whether your predictions hold up.
Context is king. Injuries, travel, schedule density, and weather impact outcomes more than most bettors realize. For injuries, consider status changes, rotation estimates, and cluster effects. Schedule density matters for back-to-backs, 3-in-4 stretches, and long road trips. Weather impacts football and baseball outcomes, while dome status or temperature adjustments affect player performance in indoor leagues. Even coaching changes and transfer portal moves in college sports can shift outcomes. Numeric features such as binary flags for back-to-back games or rolling totals for travel miles make these contexts machine-readable.
Across sports, we track core KPIs to feed ATSwins predictions. Universal team strength metrics include scoring margins, opponent-adjusted differentials, rolling expected value metrics, and home/away splits. Football-specific KPIs include EPA per play, success rate, early-down pass rates, red zone efficiency, pressure rate, special teams EPA, finishing luck, and pace. Basketball metrics cover offensive/defensive ratings, half-court vs. transition efficiency, opponent shot profiles, foul rates, pace, schedule density, and on/off impacts. Soccer features focus on xG, shot quality, xGA, set-piece xG, PPDA, and fixture congestion. Baseball KPIs include wOBA, xwOBA, barrel rates, pitch shapes, platoon splits, park factors, and bullpen fatigue. Hockey metrics focus on xGF/xGA, high-danger chances, score-adjusted Corsi, special teams, and rest days. Quantifying luck proxies like PDO in NHL, shooting luck in NBA, or turnover luck in NFL helps spot temporary performance spikes and avoid overreacting.
Feature Engineering and Odds Normalization
Static season averages lie. Instead, build rolling windows over 3, 5, or 10 games and use exponential moving averages for form. Adjust for opponent strength by regressing opponent-adjusted EPA or using schedule-adjusted net ratings in basketball. Factor in player availability by weighting performance windows according to expected rotations or snap shares. Lagged features should be used exclusively to avoid leakage, and extreme values should be winsorized.
ELO or Glicko ratings per team, rest-adjusted differentials, and form measures smoothed over recent games are durable signals when combined with matchup specifics. Interaction terms, such as O-line vs. opponent pass rush in football or shot profile fit in basketball, often unlock predictive lift. Platoon edges in baseball or forecheck efficiency in hockey are other examples. Home/away splits and travel-impact modifiers add realism, but be cautious of overfitting. Domain-informed priors and monotonic constraints help maintain stability.
Implied probabilities are the basis for comparing your model to the market. Convert moneylines to implied probability, then remove the vig. For spreads and totals, use market-consensus prices based on standard baselines like -110. Track both raw and vig-free probabilities, as these are the numbers your model must beat. Creating features from odds movement, such as opening-to-closing deltas, last-hour moves, book-to-book disagreement, and public vs. sharp splits, is critical. CLV is the compass for your model; consistent beating of the closing number indicates a likely edge.
Modeling and Calibration
Different sports require different modeling strategies. Logistic regression is a strong baseline for predicting win or cover probabilities and allows interpretability, particularly when using interaction terms. Gradient boosting frameworks like XGBoost or LightGBM capture non-linear interactions and are highly effective in tabular classification for ATS and totals. Low-scoring sports like soccer and hockey benefit from Poisson or bivariate Poisson models. Bayesian hierarchical models stabilize estimates across teams and seasons, and time-series models like dynamic ELO capture evolving form. The key is starting simple, shipping fast, then layering complexity.
Hierarchical modeling stabilizes estimates, especially for small samples, by pooling teams and players while shrinking extremes toward league averages. This is particularly useful in college sports where schedule disparities are significant. Calibration ensures honesty in predictions. Platt scaling or isotonic regression with reliability plots guarantees that probabilities reflect actual outcomes. Monitoring Brier scores and log loss by market type helps refine staking discipline and reduce emotional swings.
Bet sizing should follow expected value principles with fractional Kelly. Only place bets where your edge exceeds fees and slippage, and cap units to manage drawdowns. ATSwins translates predicted edges into recommended units, showing the bankroll impact in a digestible format.
Validation, Backtesting, and Risk
Random train/test splits are dangerous. Time-ordered splits with walk-forward cross-validation reflect live performance more accurately. Evaluate using Brier score, log loss, AUC, ROI, and CLV. Break results down by time to close, edge bucket, and market type. Monte Carlo stress tests simulate seasons to estimate drawdowns, daily volatility, and worst-case scenarios. Risk management includes never chasing steam, avoiding correlated parlays unless modeled, maintaining a “do not bet” list, and logging all bets with reasoning.
Workflow, Tools, and References
Clean, reproducible workflows are essential. Pandas for data wrangling, scikit-learn for pipelines, and PyMC for Bayesian hierarchical models are the backbone. Maintain experiment registries, versioned datasets, and clear documentation. Ethics are paramount: use licensed data, respect jurisdictional rules, and clearly communicate uncertainties. Bankroll discipline is more important than squeezing small edge gains.
Step-by-Step: Building an NBA Sides Model That Translates to Bets
Start by collecting and aligning data: game results, box scores, play-by-play, injury reports, and odds snapshots. Engineer features like rolling offensive/defensive ratings, opponent-adjusted ratings, pace, schedule density, and injury-adjusted minutes. Normalize market probabilities by converting odds and removing the vig. Train models starting with logistic regression, adding gradient boosting if needed, and calibrate using walk-forward validation. Set thresholds for EV and size bets using fractional Kelly. Ship to production, automate feature generation, and monitor every pick. ATSwins translates this process into user-friendly pick cards with clear edges, CLV tracking, and unit sizing.
Templates, Checklists, Comparative Models, and Common Mistakes
Pre-game checklists cover data freshness, feature sanity, market scans, and news risk. Feature libraries include team form, schedule factors, matchup interactions, market dynamics, and context. Model review focuses on calibration, CLV, drawdowns, and avoiding data leakage. Comparative models vary by sport, including logistic, gradient boosting, Poisson, and Bayesian approaches with sport-specific KPIs. Common mistakes include using post-game data, overfitting, ignoring calibration, chasing steam, and misinterpreting hot streaks.
How ATSwins Puts This to Work for You
ATSwins operationalizes all of the above into data-driven picks, player props, betting splits, and profit tracking. It provides edge percentages, fractional Kelly units, CLV tracking, and educational nudges explaining why a pick has an edge. Free and paid plans give access to varying levels of markets and historical tracking.
Odds Normalization, EV Thresholds, and CLV Awareness
Quick math for moneyline conversion, vig removal, and edge calculation is essential. Adjust EV thresholds by market timing: larger edges for early lines, smaller edges near close. Track average movement from your bet to close to develop CLV awareness, segmenting by book and time-of-day.
Walk-Forward Plan, Model Stalls, Repeatable Habits, and Ethics
A rolling monthly train/validate/test schedule ensures metrics remain reliable. When models stall, refresh opponent adjustments, simplify brittle features, recalibrate, and reduce stakes temporarily. Repeatable habits include versioning datasets, quarantining high-variance picks, respecting rest/travel, and avoiding forced action. Ethical practices involve using licensed data, showing uncertainties, surfacing drawdown expectations, and educating users.
Prop Modeling and NCAA Patterns
Prop modeling starts with per-minute or per-snap rates, stabilizing with hierarchical pooling. Adjust for matchup pace, role changes, and simulate totals. NCAA markets benefit from conference pooling, conservative minutes projections, pace-adjusted efficiencies, and lower stakes due to higher volatility.
Putting It All Together with ATSwins
ATSwins delivers picks reflecting model edges after vig removal, with unit suggestions via fractional Kelly and CLV tracking. Props and betting splits highlight market gaps driven by narrative vs signal. Profit tracking shows ROI, drawdowns, and variance. Free tiers give a sample; paid plans unlock earlier releases, more markets, props, and historical tracking. The platform is practical: clean data in, calibrated probabilities out, and bankroll-safe decisions in between.
Conclusion
In short, clean data, honest probabilities, calibrated models, and steady bankroll management form the core of successful sports betting. Translate odds into true chances, build stable features, and measure value versus the market close. Test small, track results, iterate, and scale confidently. ATSwins is a practical AI-powered sports prediction platform offering picks, props, betting splits, and profit tracking across NFL, NBA, MLB, NHL, and NCAA to help bettors make smarter, informed decisions.
Frequently Asked Questions (FAQs)
What does “sports betting stats-driven predictions – find value” mean?
It means you use measurable data to turn games into probabilities and only bet when the market is worse than your model. Pull clean stats, convert odds to implied probabilities, remove the vig, and bet only when there’s a stable edge.
Which metrics matter most?
Football: EPA/play, success rate, finishing luck, pace, injury impact. Basketball: shot quality, offensive/defensive rating, rebounding, schedule fatigue. Baseball: K-BB%, pitch mix, platoon splits, xwOBA, bullpen rest. Hockey: 5v5 xG, Corsi, rush/cycle chances, goalie quality. College: opponent-adjusted stats matter most due to talent gaps.
How do I convert odds and remove the vig?
Convert moneyline odds to implied probability, divide each by the sum of all implied probabilities, and compare your model probability to the fair market number. Track CLV and ROI.
How do I check if my model actually finds value?
Use time-ordered train/test splits, evaluate with Brier score and log loss, calibrate probabilities, track CLV vs closing lines, and manage stakes with fractional Kelly.
How does ATSwins help?
ATSwins scans model-backed edges, tracks line movement and splits, monitors profit and CLV, and provides clear guidance without messy spreadsheets, helping you move from raw stats to value efficiently.
Related Posts
AI For Sports Prediction - Bet Smarter and Win More
AI Football Betting Tools - How They Make Winning Easier
Bet Like a Pro in 2025 with Sports AI Prediction Tools
Sources
The Game Changer: How AI Is Transforming The World Of Sports Gambling
AI and the Bookie: How Artificial Intelligence is Helping Transform Sports Betting
How to Use AI for Sports Betting
Keywords:
MLB AI predictions atswins
ai mlb predictions atswins
NBA AI predictions atswins
basketball ai prediction atswins
NFL ai prediction atswins
using ai to predict sports
ai score prediction today
ai sports betting technology
sports betting stats driven predictions