NHL Totals Projection Algorithm: Pricing Over and Under Lines the Right Way
Betting NHL totals has never been about guessing for me. It is not about vibes, hot takes, or blindly riding overs because a team scored seven goals last night. It is math, pace, context, and probability layered together in a way that makes sense. When I build NHL totals models, I am trying to answer one simple question. How often does this game realistically land above or below a specific number like 5.5, 6.0, or 6.5?
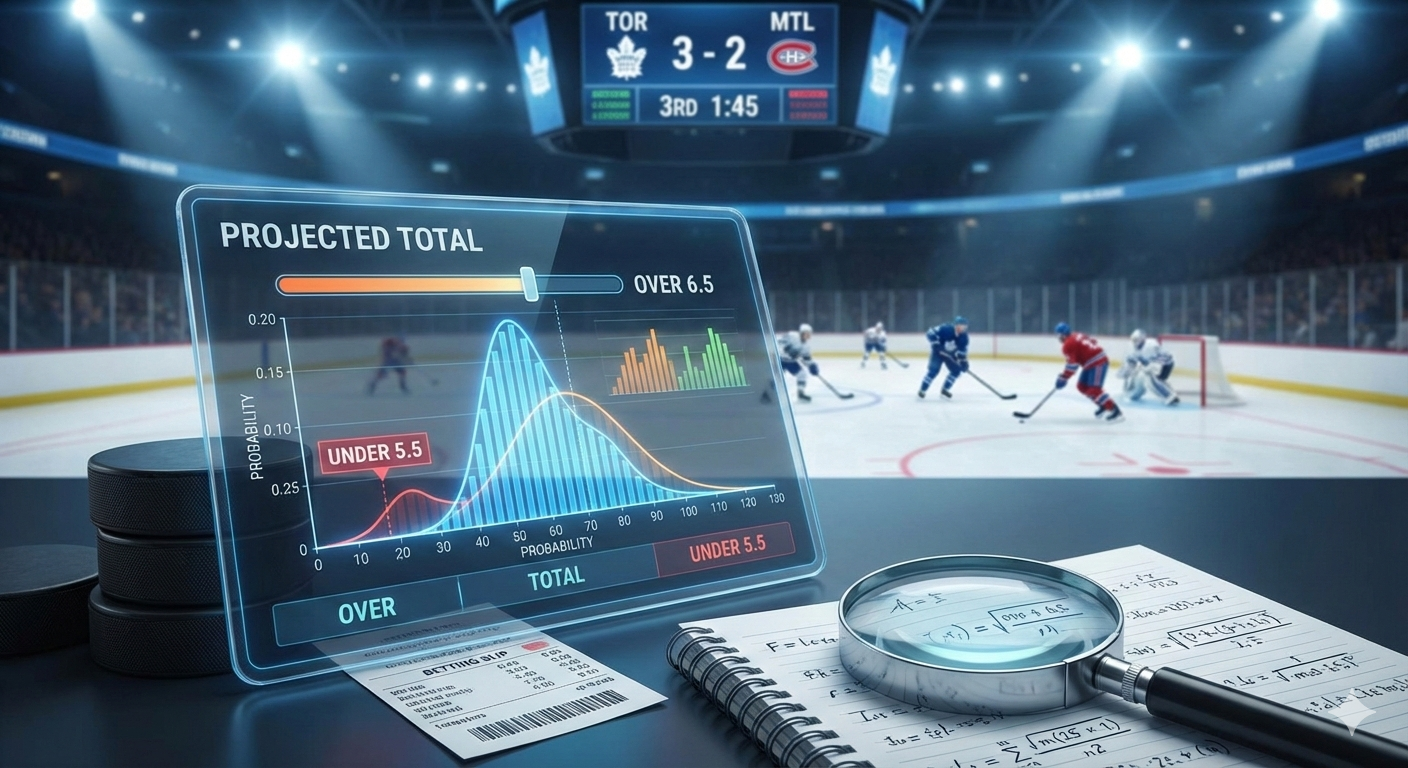
If you want to bet totals long term, you have to stop thinking in final scores and start thinking in distributions. Every game lives inside a range of outcomes. Some nights that range is tight and ugly. Other nights it is wide and chaotic. My job as an analyst is to quantify that range and price it properly.
This is the exact framework I use to project NHL totals for ATSwins . These projections feed directly into picks, alerts, and long-term profit tracking. They have to be stable, explainable, and fast enough to update when a goalie change drops an hour before puck drop. This is not theory. This is production betting work.
What follows is a full breakdown of how an NHL totals projection algorithm should actually be built if you want to trust it with real money.
Table Of Contents
- Building an NHL Totals Projection Algorithm That Traders Can Trust
- Problem Framing and Outputs
- Data Pipeline and Feature Design
- Modeling Philosophy and Structure
- Validation, Calibration, and Reality Checks
- Daily Workflow and Operations
- Step by Step Build Process
- Practical Modeling Tips That Actually Matter
- Example Outputs Traders Care About
- Making It Work for ATSwins Users
- Common Pitfalls and How to Avoid Them
- Lightweight Math Checks for Sanity
- Expanding With Machine Learning Without Losing Control
- Reliability, Speed, and Communication
- Conclusion
- Frequently Asked Questions
Building an NHL Totals Projection Algorithm That Traders Can Trust
The first mistake people make with totals modeling is not defining the output clearly. If your model just spits out “lean over” or “lean under,” it is not a totals model. It is an opinion generator.
A real NHL totals projection needs to output a full probability distribution for total goals in a game. That means zero goals through double digits and everything in between. From that distribution, you can cleanly extract probabilities for betting thresholds like over 5.5, over 6.0, over 6.5, and over 7.0. You can also derive prediction intervals and central tendencies like the mean and median.
At ATSwins, totals projections are not just used for picks. They drive alerts, confidence ratings, bankroll exposure, and post-game evaluation. That means they must be defensible. If a user asks why the model liked an under that lost 5 to 4, there needs to be an answer that goes deeper than “bad luck.”
This also means the model must handle uncertainty. Goalies change. Players get scratched. Special teams environments shift. A good totals model does not break when things get messy. It adapts.
Problem Framing and Scope
Every NHL game is a mix of repeatable signals and pure randomness. The goal of the model is not to predict the exact final score. It is to estimate how often each scoring outcome occurs if the game were played many times under similar conditions.
The model needs to work across the regular season and playoffs. That matters because playoff hockey behaves differently. Pace tightens. Defensive structure improves. At the same time, empty net situations late in games create weird spikes in total goals. Those dynamics need separate assumptions.
The model also needs to run daily with minimal manual intervention. That means automated ingestion, scenario handling for goalie uncertainty, and portability across seasons with only light re-tuning. If a model needs constant hand-holding, it will eventually fail at scale.
At the core, NHL totals are driven by five things. Team pace and shot volume. Shot quality and finishing. Goaltending. Special teams. Context like rest, travel, home ice, and late-game score effects. Everything else is noise around those pillars.
Modeling Philosophy
The backbone of the model is simple. Team goals are modeled as Poisson-like processes with opponent-adjusted scoring rates. Those rates are estimated at even strength and on special teams, then combined into a game-level expectation.
Where things get interesting is correlation. Hockey games are not independent scoring events. Penalties, game flow, and late-game strategies cause goals to cluster. To capture that, the model introduces positive correlation between team goal distributions using a shared component. This allows totals to have fatter tails than a naive independent model would allow.
Shrinkage is critical, especially early in the season. Teams do not become elite offenses or terrible defenses overnight. Hierarchical structure prevents the model from overreacting to small samples. Calibration is not optional. Every output is checked against reality continuously.
Data Pipeline and Feature Design
A totals model lives or dies by data hygiene. Sloppy inputs create fake edges that disappear the moment you bet them.
All inputs are normalized at the team and strength-state level. Five on five play is treated separately from power plays, penalty kills, and three on three. Score effects are accounted for so that teams protecting leads do not artificially appear slow or defensively dominant.
Recent form matters, but it must decay smoothly. A heater from three weeks ago should still matter a little. Last night should matter more. But nothing should dominate the projection on its own.
Special teams deserve extra care. Penalties are one of the biggest drivers of totals volatility. The model projects expected power play minutes based on team tendencies and league environment, then maps those minutes to expected goals using unit strength and opponent penalty killing.
Goaltending is handled in layers. Long-term talent sets the baseline. Recent form nudges the projection slightly. Opponent shot quality provides context. When a starter is not confirmed, the model weights scenarios based on expected probabilities and blends the results.
Rest and travel are included as small modifiers. They are real but subtle. Back to backs slightly reduce pace and finishing. Long travel with time zone changes adds fatigue. These adjustments should never swing a total by a full goal, but ignoring them entirely creates bias.
Rink effects are corrected before modeling. Some buildings inflate shot counts. Others suppress them. If you do not debias inputs, your model learns lies.
Feature Engineering Workflow
All rolling metrics use exponential decay. Team-level rates decay faster than goalie baselines. Opponent adjustments isolate offense from defense so that a team does not look elite simply because it played weak competition.
Everything is normalized to the current season environment. League-wide scoring changes year to year. Carrying raw rates forward without normalization guarantees drift.
Injury effects are applied conservatively. Losing a top-six forward matters, but it does not double a team’s scoring rate. Lineup uncertainty is handled through scenario weighting rather than hard assumptions.
Modeling Approach in Practice
The build happens in layers. First, the model predicts expected goals for and against for each team at five on five and on special teams. This can be done using hierarchical regression or machine learning models that forecast rates rather than final scores.
Next, expected goals are mapped to actual goals using calibrated conversion curves. Public expected goal models are good but not perfect. Scaling and offsets are applied by strength state to align predictions with reality.
Residual variance is added to account for finishing streakiness and garbage time chaos. This prevents the model from being overconfident.
Team goal distributions are then assembled. Each team’s goals follow a Poisson-like distribution with a shared component that induces correlation. From there, total goals are derived either analytically or via simulation.
Monte Carlo simulation is preferred when scenario mixing is involved. Each simulated game produces a total. Thousands of runs create a clean distribution that can be queried at any threshold.
Expected totals are clipped to reasonable ranges to prevent one-off anomalies from breaking the output.
Validation and Calibration
Backtesting is walk-forward only. The model never sees future data. Regular season and playoff performance are tracked separately.
Calibration diagnostics are run constantly. Probability integral transform histograms should be flat. Prediction interval coverage should match targets. If the model is too confident, tails are widened. If it is too conservative, variance is tightened.
Threshold-level accuracy matters more than mean absolute error. Betting is about lines like 6.5, not exact totals.
Expected value is calculated by comparing model probabilities to market break-even points. If edges look too good to be true, they probably are.
Bankroll guidance uses fractional Kelly with strict exposure caps. No single slate should threaten the bankroll.
Daily Workflow and Operations
On game days, data refreshes happen several hours before puck drop. Rates are recomputed. Baseline projections are generated. Scenarios are mixed for goalie uncertainty and injuries.
As lines move or goalies are confirmed, the model updates automatically. Outputs are versioned so results can be audited later.
Feature drift is monitored continuously. If overs start winning more than projected, special teams assumptions are checked first. If unders spike, pace and finishing assumptions are reviewed.
Interpretability matters. Traders want to know why a number moved. Feature attribution and scenario toggles make the model teachable rather than opaque.
Step by Step Build Process
Start by assembling multiple seasons of team-level data and schedules. Build a clean matrix of team strength by date. Estimate opponent-adjusted offense and defense using regularized regression.
Map strengths to expected goals by strength state using projected time shares. Apply finishing calibration and goalie adjustments. Add variance and correlation.
Simulate totals and extract probabilities. Backtest. Calibrate. Repeat.
Once stable, automate everything. Add alerts for missing data and abnormal outputs. Package results for ATSwins users with clear probabilities, edges, and context notes.
Practical Modeling Tips That Actually Matter
Finishing regresses. Always. Let it move projections a little, not a lot.
Special teams widen totals distributions. If both teams take penalties, tails should be fatter.
Empty net goals matter more than people think. Late-game chaos pushes totals over numbers that looked safe all night.
Ref signals should be blended carefully. Overfitting refs will ruin your model.
Debias rinks before modeling. Never after.
Example Output Traders Care About
For a high-profile matchup, the output should show a clear mean and median, probabilities at key totals, prediction intervals, and scenario adjustments if a backup goalie starts. Notes should explain why the total is volatile or stable.
This is the difference between a usable model and a spreadsheet that looks smart but does not help anyone bet.
Making It Work for ATSwins Users
ATSwins users do not need every internal detail. They need clear probabilities, a confidence score, and quick context. Backup goalie risk. Special teams environment. Rest disadvantage.
The model integrates with betting splits and profit tracking so users can see not just what the model likes, but how it performs over time. Calibration is emphasized over hype.
Edges are sized responsibly. Long-term survival beats short-term flexing.
Common Pitfalls and How to Avoid Them
Small-sample heaters will trick you if you let them. Goalies matter more than you think. Special teams variance is real. Score effects slow games down. Late-game penalties and empty net situations inflate totals.
Ignoring any of these will quietly bleed your bankroll.
Lightweight Math Checks for Sanity
Side probabilities and totals should tell the same story. If not, correlation is off.
Simulated totals and closed-form totals should roughly agree. If they do not, something is wrong in the tails.
Expanding With Machine Learning Without Losing Control
Machine learning works best when it predicts components, not outcomes. Forecast rates. Then let a probabilistic layer handle uncertainty.
Hierarchical structure keeps early-season estimates sane. Ensembling improves stability.
Never let a black box decide the final number alone.
Reliability, Speed, and Communication
Performance matters. Cache what you can. Log everything. Make debugging easy.
When communicating edges, keep language simple. Probabilities, not promises. Scenarios, not surprises. Calibration proof, not marketing fluff.
Conclusion
NHL totals betting is about pricing uncertainty correctly. Pace, finishing, goaltending, special teams, and context drive scoring. Clean data and honest calibration keep you alive long term.
Build simple first. Test relentlessly. Size edges modestly.
If you want fast execution and trusted probabilities, ATSwins delivers AI-powered sports predictions with real accountability across NHL and beyond.
Frequently Asked Questions
An NHL totals projection algorithm estimates how often games land over or under common numbers by modeling scoring rates and uncertainty rather than guessing scores. The most important inputs are pace, expected goals, special teams, goalie quality, and context. Goalie uncertainty is handled through scenario weighting. Accuracy is judged through calibration and backtesting, not vibes.
ATSwins uses this approach to generate stable, explainable totals probabilities that users can trust over the long run.
Related Posts
AI For Sports Prediction - Bet Smarter and Win More
AI Football Betting Tools - How They Make Winning Easier
Bet Like a Pro in 2025 with Sports AI Prediction Tools
Sources
The Game Changer: How AI Is Transforming The World Of Sports Gambling
AI and the Bookie: How Artificial Intelligence is Helping Transform Sports Betting
How to Use AI for Sports Betting
Keywords:
MLB AI predictions atswins
ai mlb predictions atswins
NBA AI predictions atswins
basketball ai prediction atswins
NFL ai prediction atswins