How to Spot Bad Betting Lines: A Pro’s Guide to Finding Value Fast
I’ve been deep in the sports analytics game for a while now, leaning on data, AI, and a healthy dose of skepticism to find those small edges the market tends to overlook. If you’ve spent any time around sportsbooks, you know the feeling of looking at a line and just knowing it’s wrong, but the real secret to being a long-term winner isn’t having a hunch. It is about having a repeatable, data-backed system that identifies mispriced odds before the rest of the market catches on. This guide is all about how you can start doing that. We are going to strip away the noise, break down the math into something you can actually use, and set up a workflow that helps you spot value in a crowded market. Whether you are hunting for closing line value or just trying to stop lighting money on fire, this is how you build a professional approach from the ground up.
Market math and pricing tells
Before we talk about teams or injuries, we have to talk about the math. Every single line a sportsbook posts is an opinion wrapped in a layer of profit margin. If you want to find an edge, you have to peel back that margin and look at the raw probability underneath. This is how you stop betting on the "team you like" and start betting on the math you trust. To really get a grasp on the fundamentals, understanding betting odds and probability is the absolute first step. It is the language of the market.
The first thing you need to get comfortable with is converting American odds into implied probability. It sounds like high-level finance, but it is just basic algebra. When you see negative odds, like -120, you calculate the probability by taking that number, dividing it by the sum of that number and 100, and you end up with the sportsbook's assessment of how likely that side is to win. For positive odds, like +140, you take 100 and divide it by the sum of the odds plus 100. Once you have these percentages for both sides of a bet, add them together. If they sum to 105%, that extra 5% is the house edge or the vig.
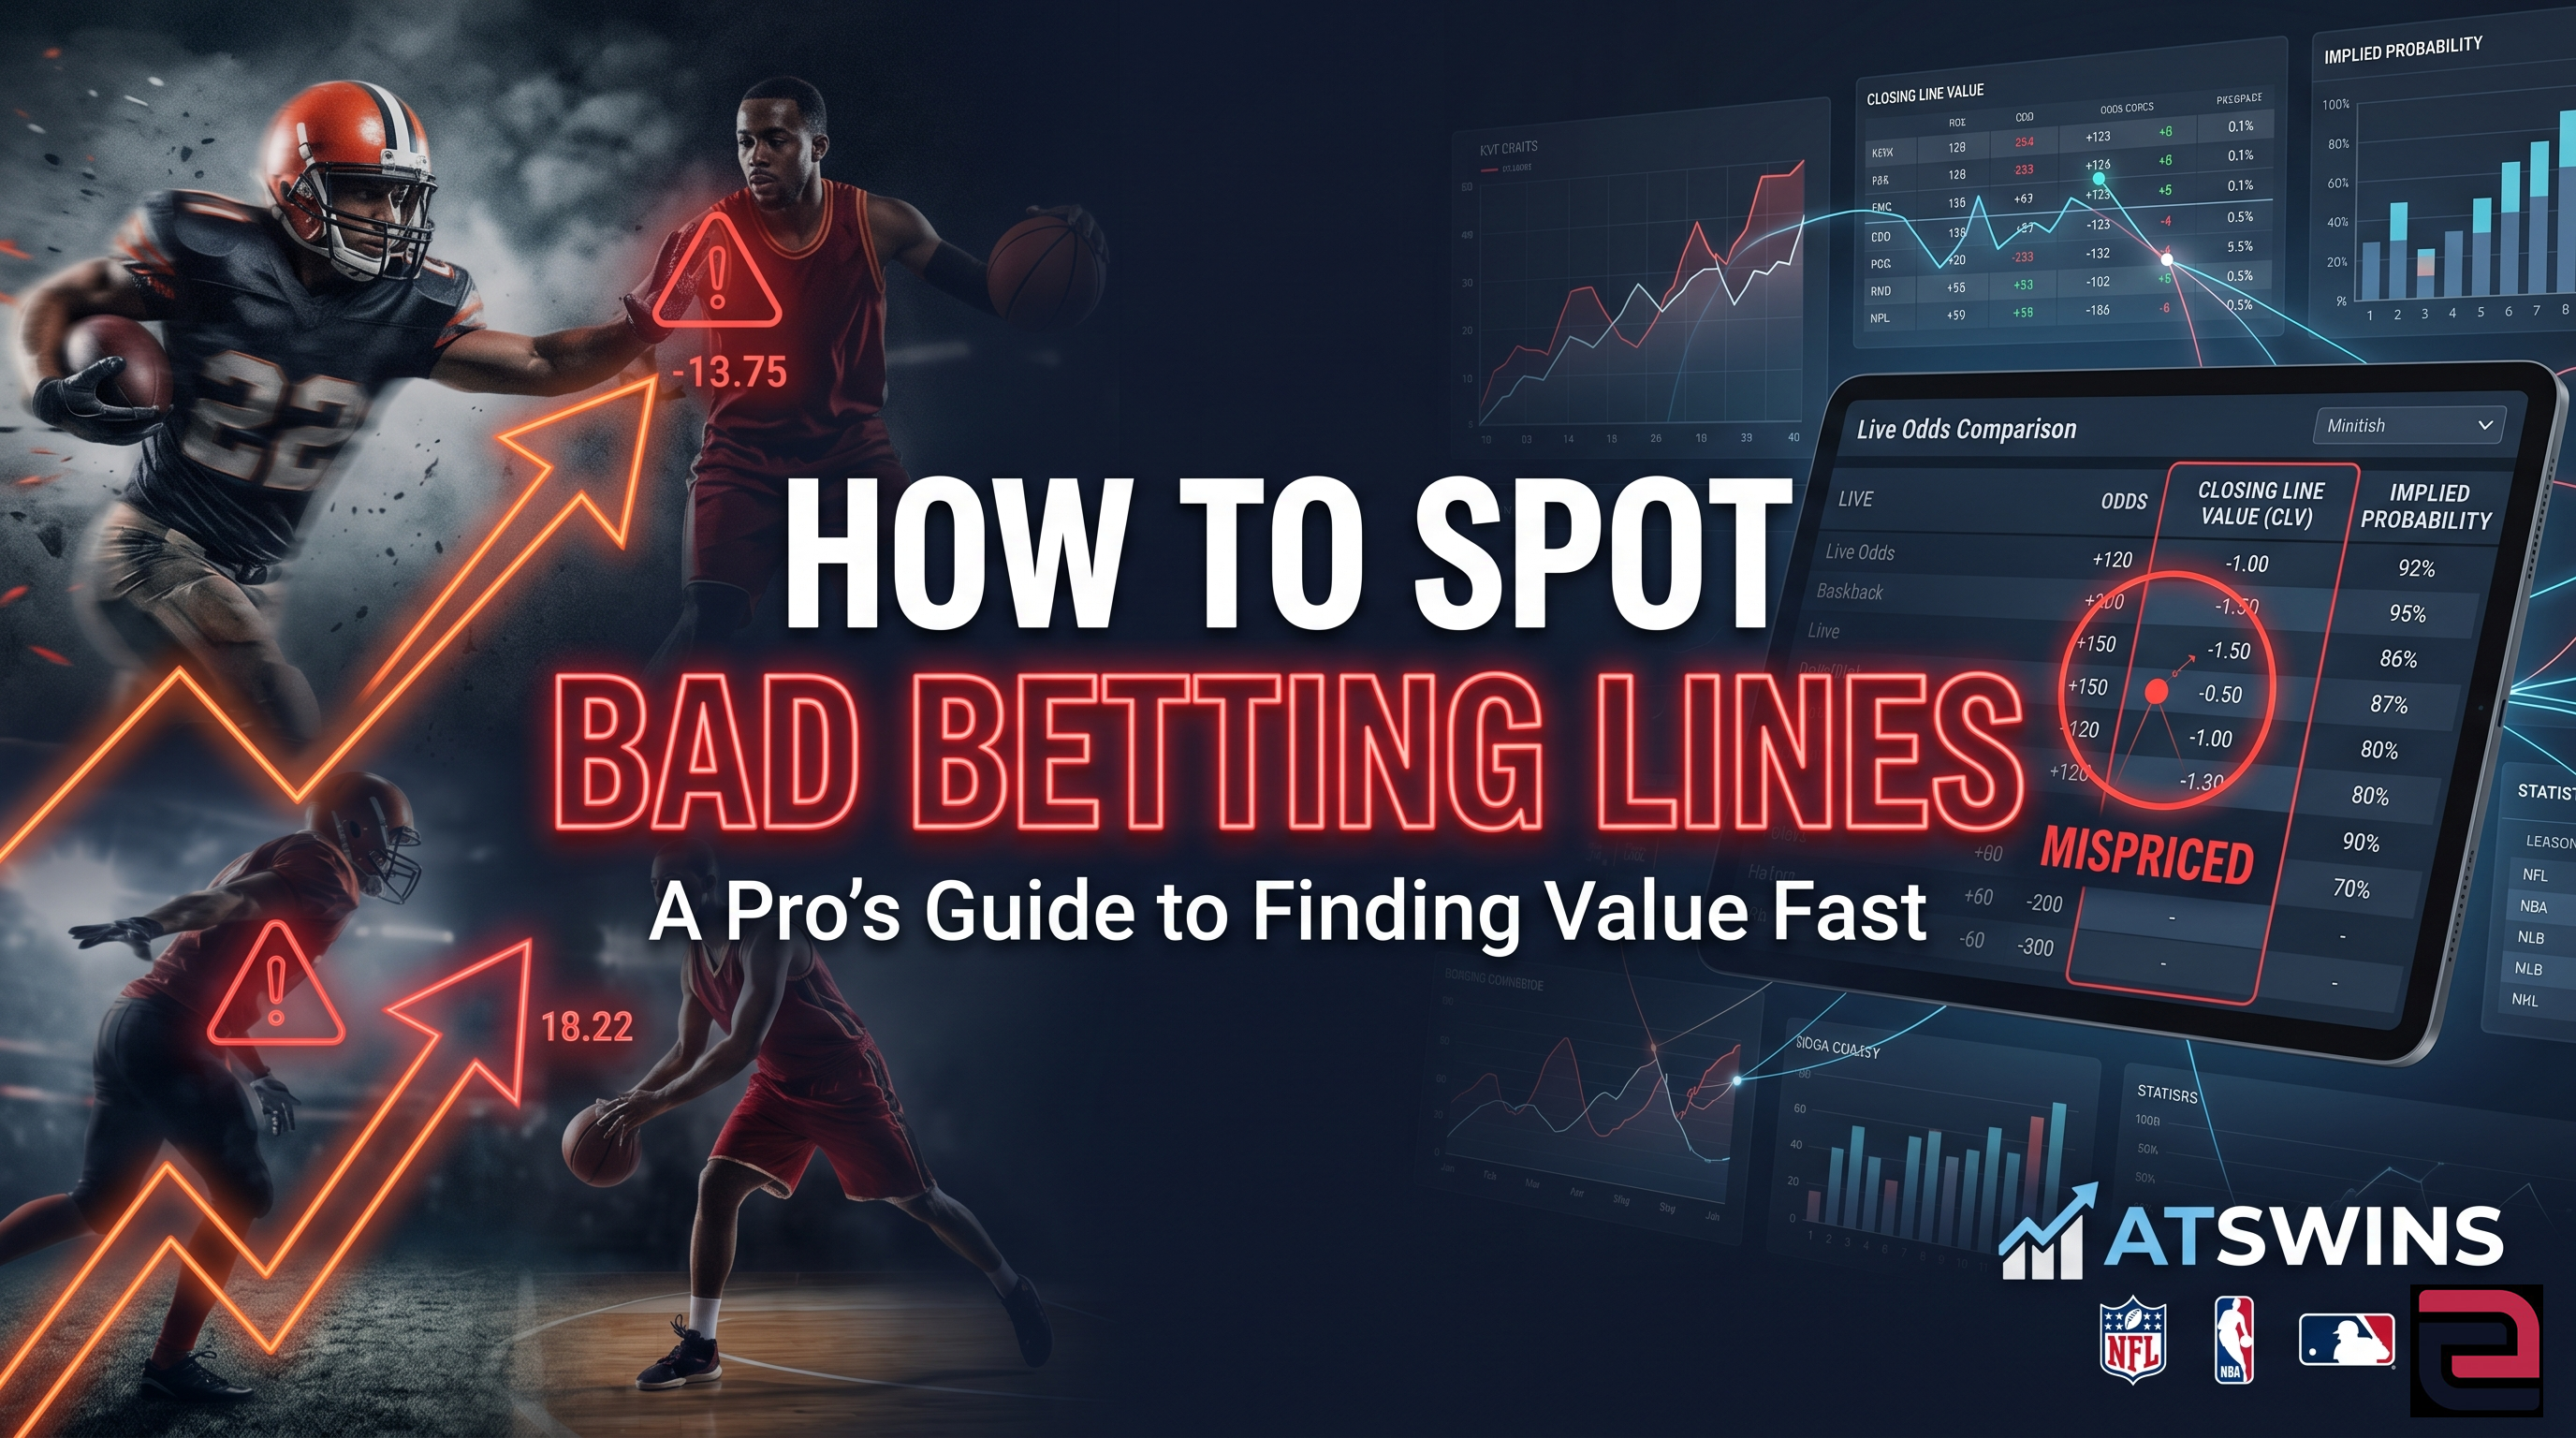
You should keep a spreadsheet handy for this. If you are using a platform like ATSwins , make sure your manual tracking aligns with their data so you aren't looking at conflicting units. If you are doing this right, you eventually stop seeing odds as arbitrary numbers and start seeing them as a distribution of probabilities. When your model says a team has a 60% chance to win, and the sportsbook is giving you a line that implies they only have a 54% chance, that is where the value lives.
For those just getting their feet wet, expected value betting for beginners is a concept that can feel intimidating, but it is really just about identifying when the price you are being offered is better than the actual probability of the outcome. Once you master the mechanics of the math, you begin to see that sports betting expected value explained in a simple way is essentially just the product of your win probability and the payout, minus the cost of the bet. When that result is positive, you have a winning strategy.
Figuring out the fair price is the next step in the puzzle. You take that vig-free probability and translate it back into odds. This tells you exactly what the "true" price of the event is without the tax. If the market is offering -130 and your fair price calculation shows -121, you are paying a premium that doesn't need to be there. Most of the time, you want to pass on those, but if your model is aggressive enough, it might still be a play. You want to accumulate as many of these small, positive-expected-value moments as you can find. It is a grind, but it is the only way to build a bankroll that lasts.
You also have to understand where the market is soft. Openers are usually where the biggest mistakes happen because the books are trying to balance early action without having the benefit of all the data. As the day goes on and money flows in, the lines get sharper. If you have a solid model and you can move fast, you want to be hitting those openers. If you are more of a consensus player, you wait for the limits to rise and then hunt for the books that are lagging behind the market-making sharp shops. It is a constant tug-of-war between liquidity and finding the best number.
Finally, keep an eye on how books shade their lines. If a popular team or a big-market franchise is playing, you are almost always going to pay a "brand tax." The books know casual bettors love the favorites and the overs, so they inflate those prices. You can exploit this by looking for the opposite exposure. When everyone is betting the favorite, the underdog is often undervalued. This is where you really start to separate yourself from the average bettor.
Line movement and off-market detection
Once you have your math down, you need a way to read the market like a compass. You don’t need twenty different screens, but you do need a handful of sharp sources. You want to track the consensus line—the middle-of-the-road price across the books that actually move the market. When you see an outlier, that’s your signal to pay attention.
You don't need to chase every little move. A one-cent shift is usually noise, but a five-cent move in baseball or a half-point shift in the NFL? That’s actionable. You should have specific triggers for each sport. If the consensus says -3 and one book is still sitting at -2.5, that is a prime target. You need to get into the habit of checking these numbers at the same times every day so you can start to recognize the patterns in how lines move.
"Steam" is another concept you need to respect. This is when you see a coordinated move across all the sharp books at once. When that happens, the public books are going to scramble to catch up. If you are fast, you can hit the lagging books before they adjust to the new reality. If you are slow, you are going to get stuck with a bad number, so you have to be ready to walk away. Chasing steam after it has already happened is one of the fastest ways to destroy your ROI.
Limits are also a great tell. If a book is keeping its limits low while the rest of the market is raising them, it’s a sign they aren't confident in that number. It’s a red flag that the line might be vulnerable to another move. You might still place a bet there, but you should probably keep your stake on the smaller side. Information is the fuel for these markets, and knowing when news is about to hit—like injury reports or starting lineup changes—gives you a massive head start.
Data-driven checks and quick modeling
You don’t need to be a data scientist to build a decent power rating, but you do need to be disciplined. Your baseline should account for the basics: team strength, rest, travel, and home-field advantage. You don’t need to overreact to every single game. A simple rolling average of the last three to five games is usually plenty to keep you in the ballpark of reality.
The real magic happens in the situational adjustments. If your model doesn't account for a star player being on a minutes restriction or a pitcher’s home-park splits, you are going to get crushed by people who do. You should maintain a structured sheet for these tweaks so that when news breaks, you aren't guessing. You already have a numeric value for what a certain injury is worth to the point spread.
Every time you identify an edge, you have to verify it against distribution reality. If you think you found an edge on a total, but your model ignores the fact that 0.5 points matter way more at a key number like 44 in the NFL than it does elsewhere, you are fooling yourself. A quick gut-check against historical data will keep you from making those amateur mistakes.
Risk management and execution
You can have the best model in the world, but if you don't manage your bankroll, you will eventually go broke. I generally stick to fractional Kelly for sizing because it helps keep the variance in check. You don't need to swing for the fences on every single play. The goal is to grow the bankroll steadily over the long term.
Focus on the markets where you actually win. Your closing line value—or CLV—is your ultimate scoreboard. If you are consistently beating the market close in NBA totals but you’re losing money on NFL sides, stop betting NFL sides. It is simple, but it is incredibly hard for people to actually do because they want to bet on everything.
If you find yourself constantly chasing steam and getting the worst of the number, force yourself to take a step back. If the number is gone, it is gone. There is always another game tomorrow, and there is always another line to analyze. Discipline is the difference between a gambler and a sports investor.
Step-by-step: from raw line to decision in under 2 minutes
When you are deep into your workflow, you should be able to get from a raw line to a decision in less than two minutes. It starts by pulling the market and normalizing the probabilities to account for the vig. Then, you load your fair number and layer in the situational tweaks—the injury news, the weather, the travel factors.
Once you have your adjusted fair probability, calculate the edge and the expected value. If that value is positive and the consensus agrees with your direction, you are in business. Check your news risk one last time, look at the limits, and if everything looks green, fire the bet. Then, log it immediately. Do not skip the logging part. Without a log, you don't have a business; you just have a memory of some games you watched.
Practical templates you can copy
You want to keep your spreadsheets clean and repeatable. Use cells to automate your conversions—have one for American to implied, another for vig-free fair price, and one for EV per dollar. Your log should have columns for the time of the bet, the book you used, the line you took, the consensus close, and your final CLV. If you aren't looking at these numbers every week, you are flying blind.
Common traps that create bad lines (and how to exploit them)
The market loves a good story, but stories don't win bets. The biggest trap is the narrative premium—the idea that a team coming off a massive win is suddenly a powerhouse. The books know the public will chase the recent result, so they shade the line, and that is where you come in.
Injuries are another area where the market lags. When a player is listed as "active," casual bettors assume they are 100%. If you know they are on a limited rotation, you have a massive advantage. Weather is the same way. If you are the person who checked the wind speed before the bookmakers updated their totals for a Sunday night game, you have already won half the battle.
How ATSwins fits into this workflow
Using a platform like ATSwins is about speed and clarity. When I look at their projections, I’m using them as a baseline for my own fair numbers. It saves me the time of manually calculating everything from scratch, which means I can focus on the situational adjustments that actually drive my edge. Their betting splits are also essential for seeing where the public money is moving so I can decide if I want to fade that narrative or wait for a better price. It is a powerful tool for scaling your volume without losing the precision of a handcrafted model.
Fast reference: numbers you should memorize
Keep a cheat sheet on your wall. Know that -110 is 52.38%, -120 is 54.55%, and -130 is 56.52%. You should know the off-market triggers for your core sports by heart. In the NFL, a half-point is a huge deal around key numbers. In baseball, five cents is your baseline for an alert. If you keep these numbers top of mind, you will spot bad lines while you are still reading the injury reports.
Where to study and validate
There is plenty of free data out there if you know where to look. Pro-Football-Reference is a goldmine for NFL data. For basketball and hockey, the equivalent sites are perfect for looking at rotation and ice time trends. If you want to get into the modeling side, grab some historical datasets from Kaggle. There is no excuse for not having the raw data you need to be competitive.
Putting it all together: a realistic daily flow
Your daily routine should be like clockwork. In the morning, you scan the openers and set your alerts. Throughout the day, you update your model with the latest news and consensus moves. Before the games start, you do your final check, place your bets, and make sure your logs are up to date. Do that for a month, and you will start to see the difference between "guessing" and "investing."
Conclusion
At the end of the day, beating the market isn't about being a genius. It’s about being methodical. You strip out the vig, you compare your math to the consensus, you watch for news, and you manage your bankroll with an iron fist. It is not always exciting, but it is effective. ATSwins is an AI-powered sports prediction platform that does the heavy lifting on data-driven picks, player props, and betting splits across the NFL, NBA, MLB, NHL, and NCAA. Their tools and guides are designed to help you turn all that messy information into a smart, consistent decision-making process. Stay disciplined, keep your logs, and stop betting with your gut.
Frequently Asked Questions (FAQs)
What is a bad betting line and how do I spot bad betting lines fast?
A bad betting line is simply a price that doesn't reflect the actual probability of the outcome. To spot them quickly, you have to be able to convert odds into probabilities and strip out the book's margin, or vig. Once you have that "fair" number, you compare it to what the market is offering. If you find a discrepancy, that's your edge. Beyond that, it's about identifying lines that are out of sync with the broader market consensus. The quickest way to know if you are finding bad lines is to track your closing line value. If you are consistently taking a better number than the final closing line, you are doing it right.
Which signals help me spot bad betting lines before they move?
The biggest signals are information-based. Injury news, starting lineup changes, and unexpected weather shifts are your primary targets. When that info hits, there is a small window before the books react. You should also watch for "steam"—that coordinated movement where market-making books all shift at once. If you are faster than the consensus or you catch a lagging book that hasn't updated yet, you have found an opening. Keep a simple, repeatable checklist: news risk, consensus, your fair price, and liquidity.
How do I use implied probability (and remove vig) to catch bad betting lines?
The process is straightforward. First, you convert American odds to implied probability. If you have a two-way market, add those two probabilities together. Any percentage over 100% is the vig. You then divide each individual probability by that total to get your "no-vig" probability. That final number is your fair market read. Compare that to your own model’s prediction. If your model gives a team a 60% chance to win but the "no-vig" market price implies only 55%, you have found a 5% edge. From there, you just need to size that bet properly.
Can AI actually help me spot bad betting lines, and how does ATSwins.ai fit?
AI is a massive force multiplier. It helps you process data in seconds that would take you hours to crunch manually. It helps with building baseline projections, flagging those off-market lines, and tracking your performance over time. ATSwins.ai provides an AI-powered sports prediction platform that gives you data-driven picks, player props, and betting splits across the major leagues. It functions as a partner to your own analysis. You can use it to see where the sharp money is leaning, keep your betting logs clean, and calculate your edge without spending all your time in a spreadsheet.
What mistakes should I avoid when trying to spot bad betting lines?
The most common mistake is confusing a single result with a good process. You can lose a bet that had a massive mathematical edge, and you can win a bet that was purely lucky. Don't fall into the trap of changing your strategy just because of one bad weekend. Avoid chasing steam when it’s already moved, and never ignore news risk—if you are betting before a lineup is finalized, you have to account for that extra uncertainty. Most importantly, keep your bankroll management tight and don't let your emotions dictate your stake size. Stick to your system and let the math work for you over the long run.